Measuring transition risks
With more than $100 trillion of global assets now under a net zero, are decarbonisation efforts reflected in market pricing? Looking at ‘Distance to exit’ can be a useful tool in judging whether climate action is reflected in stock returns.
As the world moves to renewable energy sources, businesses face transition risks. Progression towards carbon neutrality brings considerable uncertainty. Climate policy can change quickly, and there are damaging reputational consequences for neglecting environment responsibilities. There may also be shifts in investor attitude and technological innovation. Understanding the extent of this transition risk, and its impact on investor returns, is vital in the construction of net zero portfolios.
Fulcrum has worked with Imperial College London to create a framework for measuring transition risk. This framework combines the scientific and social objective of decarbonising the economy with forward-looking elements of risk to understand its impact on asset pricing. It looks at the extent to which it is reflected in current valuations, and whether it affects sector diversification in portfolios.
Net-zero portfolios aim to reduce aggregate carbon emissions to zero by a specific date. They are becoming a popular vehicle, reflecting a growing desire among institutional and retail investor preference for investments that do not contribute to climate change. They are also an increasingly important part of global capital markets, with more than $100 trillion of global assets under management currently covered by various net-zero investment initiatives.¹
Net-zero portfolios combine two elements: an annual carbon budget based on independent scientific projections, and the investor’s methodology for selecting companies. As the carbon budget gets progressively tighter, companies failing to improve their carbon footprint are more likely to exit net zero portfolios. Investors should require compensation for bearing this higher transition risk.
Example of annual carbon budget of a hypothetical portfolio (in gigatonnes of CO2-equivalent).
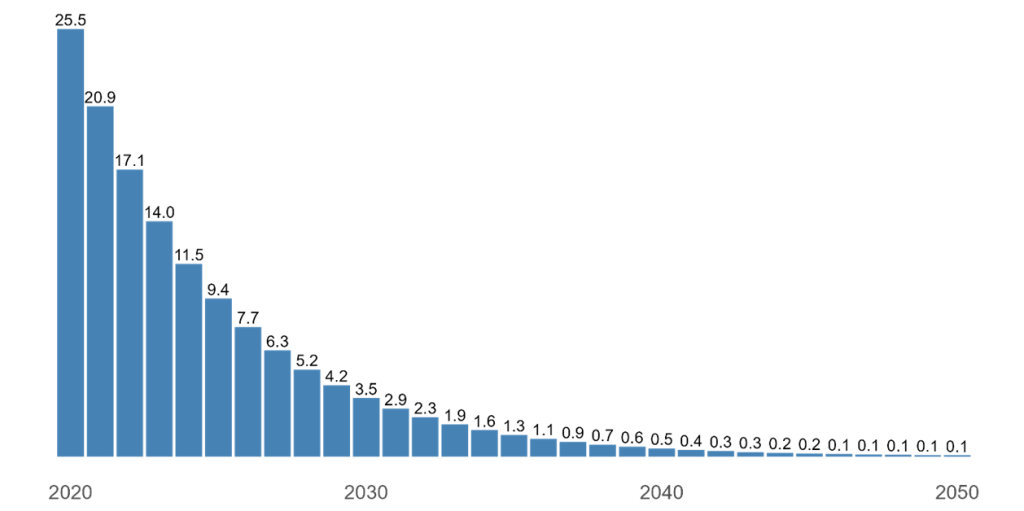
Source: Fulcrum Asset Management
The Fulcrum research aims to reflect this progression, using a new method to measure the point at which companies are excluded from net zero portfolios. ‘Distance-to-exit’ (DTE) calculates the distance, in years, until a company is removed. DTE is a forward-looking measure of carbon-transition risk implied by investor preferences. In theory, companies with low ‘DTE’ scores should have lower valuation ratios and higher expected returns.
Pricing and decarbonisation
The research identified three direct channels through which the pricing effect could operate on a company’s share price. First, there may be divestment by a significant number of investors, who decide they no longer want to take the environmental risk on an individual company. Alternatively, investors may start to anticipate future divestment, which could impact the price. Finally, through net-zero portfolios and engagement programmes, investors could communicate their expectations of future divestment to corporates, and thus exert pressure on corporates to adjust their environmental behaviour. In this way, net zero portfolios can be a tool for both divestment and engagement.
In examining whether transition risk is captured by investment valuations, the research considered three ways in which investors may exclude companies from net-zero portfolios, an in turn determine DTEs: the first looked at companies’ total emissions. This assumes that the amount a company is emitting today can be a predictor of future decarbonisation efforts. It prioritises companies with lower total emissions and takes into account scope 1, 2 and 3 emissions, measuring direct emissions and those across a company’s supply chain.
Second, it looks at predicted total emissions. Decarbonisation inevitably takes time, so this approach assumes that what matters most is where companies are later on, not necessarily where they are today. It takes a weighted average of pre-announced, self-reported firm commitments to decarbonise and past emissions trends.
The third approach combines current and future emissions to give an ‘ambition score’. It aims to capture both a company’s intention and ability to decarbonise their future activities. To do so, it looks at historical emissions levels and their growth rates (50%), historical emissions intensities and their growth rates (25%), and forward-looking climate-related activity metrics (25%). This is the toughest measure of a company’s emissions.
Strong association
Across all specifications, the research showed a statistically strong negative association between DTE and stock returns. The results are economically large: a one-standard-deviation increase in DTE is associated with an approximate 2.5-4.6 percentage-point reduction in the next month’s annualised stock returns. While the predictive power of DTE declines over a longer time period, it remains significant, even looking out 12 months. These results support the hypothesis that companies with lower DTE are more risky and investors require higher compensation from them.
On three key measures of value, price-to-earnings, price-to-book, and price-to-sales, the research shows a strong positive correlation with DTE and lower valuations. These results suggest that decarbonisation is a differentiating factor for investors, leaving those companies with a weaker decarbonisation profile priced with lower multiples than those where there is less pressure. This shows transition risk is real. Equally, the correlation is stronger when the most comprehensive metric of decarbonisation is used – the ‘ambition’ score outlined above – and also when scope 3 emissions (regarded as more ‘noisy) are excluded.
Sector bias
There have been concerns that in targeting net zero, investors may introduce sector or thematic biases into a portfolio relative to their benchmark. This has been a particular concern more recently, with the war in Ukraine creating significant volatility in energy-related sectors, creating a gap in portfolios able to hold fossil fuel companies and those who could not. However, over the longer-term, our research suggests that it is possible to construct net-zero portfolios that have relatively limited expected tracking error, ranging between 0.08% in 2021 and 1.9% in 2050. Portfolio decarbonisation is feasible without losing diversification benefits. Over time, net zero portfolios do not create a strong tilt away from any individual industries.
So, are decarbonisation efforts reflected in market pricing?
The framework described in this summary paper can be applied to examine the carbon-transition risk implied by investors’ preferences. The DTE is significantly related to cross-sectional variation in stock returns and their valuation ratios. This is encouraging for investors in net zero portfolios, suggesting that markets increasingly value the decarbonisation efforts of companies, and may influence corporate behaviour by impacting corporates’ cost of capital.